


Headwind #3 For Banks: Fear Of Biden/Warren/Waters = Dividend Cut, More Capital,

Background
My goal is to not get into a political debate. I don’t care who you vote for, and I am not trying to persuade you to vote for one candidate or another.
My goal as a serious investor with a material position in bank equities is to evaluate a third headwind that I believe has contributed to today’s near record low valuations. This third headwind complements the first two headwinds: Investor Confidence and Uncertainty.
To understand the risk to bank stocks of a Democrat sweep in the 2020 election, it is helpful to review a couple things about bank capital and returns. Numbers around capital and returns provide a fact-based, analytical framework for understanding the risk of a Democrat sweep that will likely elevate Elizabeth Warren and Maxine Waters together with Joe Biden as the most influential bank policy makers in the U.S.
While I remain reasonably confident that long-term (10 years+) bank investors will be little impacted by a Democrat sweep in 2020, I do think investors with a shorter investment time horizon should be cognizant of factors that could cause bank valuations to fall further from today’s near record lows.
Return on Shareholder Capital Determines the Total Returns of Banks Over Time
My research shows one factor more than any other determines a bank’s total return (i.e., dividends plus stock price appreciation) over time. That factor is Return on Equity (ROE).
Over time (five years+), banks with consistently high ROEs always outperform banks with low ROEs. Also, over time, banks with consistently high ROEs outperform banks with inconsistently high ROEs.
The key metric for best forecasting future shareholder returns is the Risk-Adjusted Return on Equity (RAROE). It measures absolute ROE by quarter over time as well as the volatility (variation) of ROE over the same time.
Here’s the formula:
RAROE = ROE (over time) minus Standard Deviation of ROE (over same time).
RAROE is best calibrated over a minimum of 10 years. My preferred time is 15 years as 15 years usually tests a bank’s earnings power over multiple business cycles.
My book, Investing in Banks (RMA, 2016), describes in detail the statistics and analysis of RAROE for publicly traded banks from 2004 to 2014.
This post brings some data current through 2Q 2020. (You are getting a sneak peak of some of the analysis that will be in the next edition of Investing in Banks.)
If a bank investor understands charts 1 and 2, they will have a sound foundation for making fact-based informed bank investment decisions that improve the probability over time of achieving alpha.
Note that each chart shows median annual total returns for ten groups of banks stack ranked on their RAROE since 2004. “A+” banks are the banks with the top 5% RAROE since 2004 while the “F” banks represent the bottom 5%. The higher the alphabetical grade, the higher the RAROE.
This article is not the place to get into a more detailed analysis and discussion of RAROE. My goal in showing these two charts is to show that, statistically and graphically, ROE and, more specifically, RAROE, are incredibly important metrics to bank shareholders.
Note that chart 1 shows median annual total returns since 2004. Chart 2 shows median annual total returns since 10 years ago.
Key takeaways: Higher RAROE banks outperform lower RAROE. ROE matters to bank investors.
Chart 1
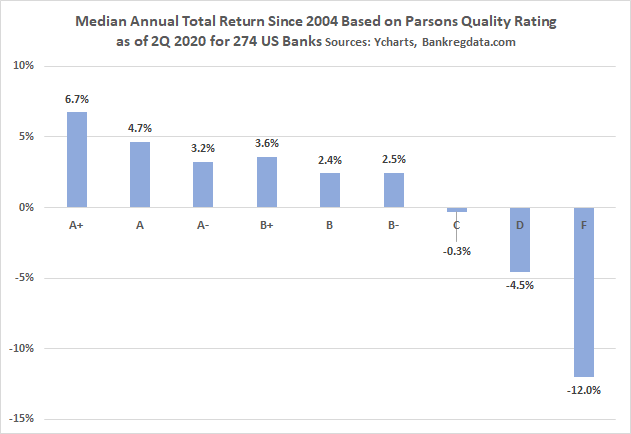
Chart 2

Equity Capital Ratios
The second set of background numbers to be examined are bank capital ratios over time.
The math is indisputable: Equity capital ratios are a major determinant of a bank’s ROE since the “E” (Equity) is the denominator in the ROE ratio. The higher the equity, all things being equal, the lower the ROE.
Bank Capital (Equity) Ratios
It is impossible to understand bank returns on equity without understanding how bank capital (equity) ratios have changed over time. The FDIC (and other bank regulators) have multiple metrics for measuring bank capital.
We will start with the basic metric, the Equity…
Read More: Headwind #3 For Banks: Fear Of Biden/Warren/Waters = Dividend Cut, More Capital,